


Coating & Laminating Special Report, Part 6
- Published: December 31, 2004, By Paul J. Frost, PJ Assoc.
Part 1 | Part 2 | Part 3 | Part 4 | Part 5 | Part 6
Smart Converting: SPC for Webs
Although many roll goods manufacturers and converters have attempted to implement Statistical Process Control (SPC) in their production areas, few have been successful. The reasons behind this problem lie with the basic statistical assumptions in the calculation of process capability and the use of Shewhart Control Charts.
Process Capability calculations assume:
- The process is in statistical control.
- A single, normally distributed population is produced over time.
- Each part produced has a unique value.
- Individual parts are independently and identically distributed (IDD).
- Subgroup samples are rational.
Let’s now consider each of these assumptions.
The process is in control. The majority of roll goods manufacturers that have attempted process capability analyses have used one of the following techniques:
- Many assumed that process capability could be defined by taking a minimum of 25 consecutive end-of-roll physical samples with each of these samples containing subgroup sizes of four (or more) from cross-directional (side-to-side) test locations while the process was at "steady state."
- Still other manufacturers believed their process capability could be defined through the use of historical data.
- A few manufacturers calculated process capability by selecting a single roll of product that had been run at "steady state" and testing virtually 100% of the roll.
Each of the these techniques has major flaws that preclude the ability to truly define the actual process capability of a roll goods manufacturing process.
To begin with, "steady state" calculations may or may not include all the process sources of natural variability. In many manufacturing operations, control loops for solids and/or viscosity, for example, may take hours to occur. Should samples be taken in less than that time, standard deviation calculations will be low resulting in artificially low control limits.
In many instances, 25 consecutive end-of-roll samples represent less than a day’s production. A single day’s production can never include the normal longer-range sources of machine, raw material, and environmental effects impacting product variability. These may take several days to a number of months to occur.
Also, because the process is at "steady state" does not mean that assignable causes are not present. Unless a conscious effort is made to find and eliminate assignable causes before capability studies are performed, the resultant standard deviation statistics will be inflated resulting in incorrect (wide) control limits, regardless of the control chart system utilized. Examples of steady state assignable causes might include out-of-round rolls, nonuniform drying, incorrect roller speeds, and out-of-control (but not necessarily out-of-specification) critical raw materials.
In the second case, historical data always is comprised of multiple populations. Some of these may be assignable and some inherent. Cross-directional profiles, machine harmonics, seasonal changes, machine wear, and operator adjustments are all sources of different populations.
Process capability definitions never can be valid until assignable causes are eliminated and inherent sources of multiple populations such as certain types of cross-directional profiles and machine harmonics are defined.
In the third case, the 100% analysis of a single roll of product will never have all the normal time sources of variability impacting the process and cannot be used for process capability studies. A single, normally distributed population is being produced over time. Although it is possible for a single population of product to be produced over a specific time period, a typical production run normally will consist of multiple populations. These may be due to inherent cross-directional profiles, machine harmonics, raw material batch changes, operator equipment changes, short-term environmental changes, etc. In other words, typical within run and run-to-run product variation is a composite of inherent populations and, usually, assignable causes.
This composite may or may not approximate a normal distribution over time. Roll variability studies must be performed to understand and quantify expected patterns and levels of variability; otherwise, product disposition and/or SPC judgments will be flawed.
Each individual part has a unique value. Roll products do not consist of "parts", rather product variability is "integrated" in all directions. This means that a roll product can have an infinite number of test values depending on the test location within the roll. For roll goods, there is no such thing as "a single unique value." This assumption, however, is a critical component of conventional statistical process control.
Individual parts are independently and identically distributed. Roll product test measurements are almost never IID. With few exceptions these measurements are correlated. Correlation effects can and do take place in both the cross (side-to-side) direction (cross correlation) and the machine direction (autocorrelation). Standard deviation calculations, therefore, cannot be perfomred in the normal manner. In essence, the impact of correlated data on any roll goods SPC systems will preclude the use of normal Shewhart control limit calculations.
The subgroup samples are rational. Nearly all roll goods manufacturers that attempt to utilize conventional (Shewhart) SPC X-Bar and R charts do so via the use of end-of-roll physical samples. In these cases, two or more test values are obtained in the cross (side-to-side) direction. These test value groupings are assumed to be rational subgroups. In fact, these samples are only representative of side-to-side variability and are nearly always cross correlated. In addition, if the production machine is producing material having a cross-directional profile, the individual samples will come from different statistical populations. Quite simply, this means that samples taken in the cross direction never can be rational. Rational subgroups must come from a single, normally distributed population produced over time and must be random and independent with regard to their selection from that population.
To demonstrate the dangers of using Shewhart X-Bar and R charts using end-of-roll cross-directional test locations, let us review two examples. In each case, control limits were generated using the overall production run averages (X Double-Bar) and the average cross-directional test ranges (R-Bar). Shewhart A2, D3, and D4 values were used in these calculations.
In summary, the application Shewart SPC to a roll goods manufacturing system nearly always will result in misleading and/or erroneous conclusions that, in turn, will impact the understanding and minimization of variability within the manufacturing arena. Converters must be trained on and must use the statistical tools that are designed for continuous processes and that will provide maximum benefits to SPC and Six Sigma practitioners.
Example #1
In this case, test values were obtained at from both edges and the center. Therefore, subgroup sample size is 3. A total of 32 rolls were produced in this run.
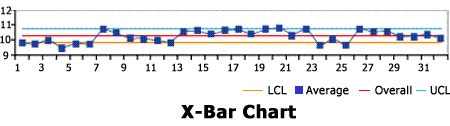
X-Bar Chart clearly shows the very large number of apparent out-of-control points and patterns on this chart. This chart would suggest that the process is entirely out of control!
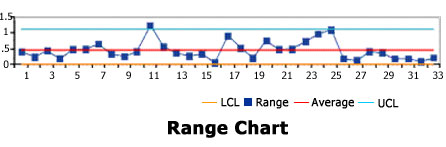
Range Chart suggests that only one point is out of control. It is important to stress that this chart "looks" at cross-directional range. Because the samples are cross correlated, the use of Shewhart’s R-Bar and D2 and D3 is incorrect. As you will see later, the upper ontrol limit, in particular, is artificially low, further suggesting that none of the test values are out of control.
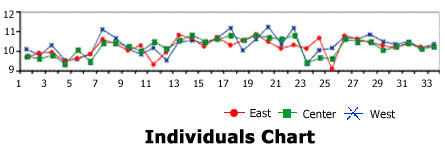
Individuals Chart clearly shows a cross-correlation effect with all three test values tending to track together throughout the run. In other words, as the overall system shifts up or down, the individual test values tend to track up and down. In addition, one should note the relative randomness of the test values at the end of each roll. No one value is always high or always low. This suggests a flat side-to-side profile.

CD Profile clearly shows the flat cross-directional profile. It should be noted that a statistical test, the Analysis of Means, should be used to confirm this conclusion.

Control Limit Comparison compares the Shewhart X-Bar control limits using cross-directional subgroups of three with the actual natural variability of the system with limits adjusted to n=3 for comparison compatibility. In this case, the Shewhart control limit values understate the real values by more than 75%. Bottom line: The entire production run was in control. In this case, the use of cross-directional samples in the calculation of Shewhart X-Bar charts would have resulted in total havoc in the production area. An incredible amount of manpower and production time would have been spent in attempting to find and correct bogus out-of-control sources. Those involved, from upper management to the production operators, would quickly reach the conclusion that SPC was ineffective in their operation. Is it any wonder why plant after plant has tried and discarded the use of conventional SPC?
Example #2
In this case, edge and center values were used also; however, the total number of rolls produced in this production run was 285.
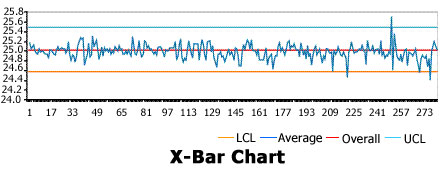
X-Bar Chart shows far fewer (three) out-of-control points. Chance would result in one out-of-control point in every 390 subgroups taken. Therefore, this would suggest this process is very nearly in control.
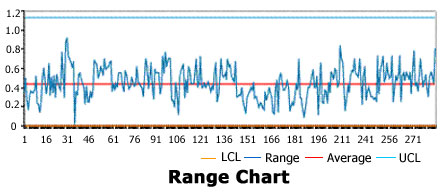
Range Chart also would suggest the process is in control; however, the "control" in this case is cross direction, not machine direction.
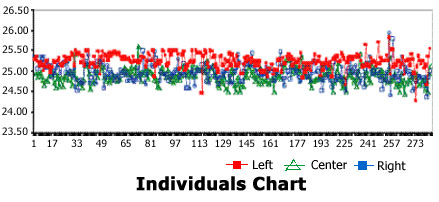
Individuals Chart clearly exhibits a pattern of nonrandom variability with individuals samples taken from the center of the process nearly always having the highest test value. This pattern exists over time and indicates a "crown" cross-directional profile.

CD Profile clearly shows the "frown" profile suggested by the Individuals Chart above. In this case, this profile was inherent; that is, always present during every production run. It is critical to mention that any CD Profile, whether inherent or assignable in nature, always will result in more outgoing product variability when compared with a "flat" profile.

Now we can see the impact of this cross-directional profile on the actual product variability in Figure 10. The X-Bar control limit range clearly is too wide due to the influence of the CD Profile in the calculation of these limits. In addition, it is very possible for this "one size fits all" chart to call out-of-control instances "in-control" and in-control instances "out."
References
- Grant and Leavenworth. Statistical Quality Control. 5th Ed.
- Montgomery, Douglas C. Introduction to Statistical Quality Control. 2nd Ed.
- Schatzoff, Martin. Advanced Statistical Methods for Web Product SPC.
- Frost, Paul and Edgar Gutoff. Application of SPC to Roll Products. 3rd Ed.
Paul J. Frost, president of PJ Assoc., Marina Bay, MA, specializes in roll goods processes, having taught these techniques in the US, Europe, Australia, and the Caribbean. Frost graduated from the Univ. of New Hampshire with a B.S. in chemical engineering and received an MBA from the Univ. of Hartford. Contact him at 617/471-3798 or This email address is being protected from spambots. You need JavaScript enabled to view it..';document.getElementById('cloakf09baf886f512f5986b763e6803ed6fc').innerHTML += ''+addy_textf09baf886f512f5986b763e6803ed6fc+'<\/a>';
Part 1 | Part 2 | Part 3 | Part 4 | Part 5 | Part 6